 By

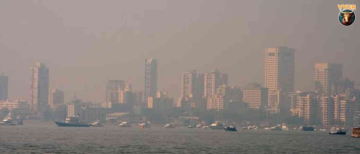
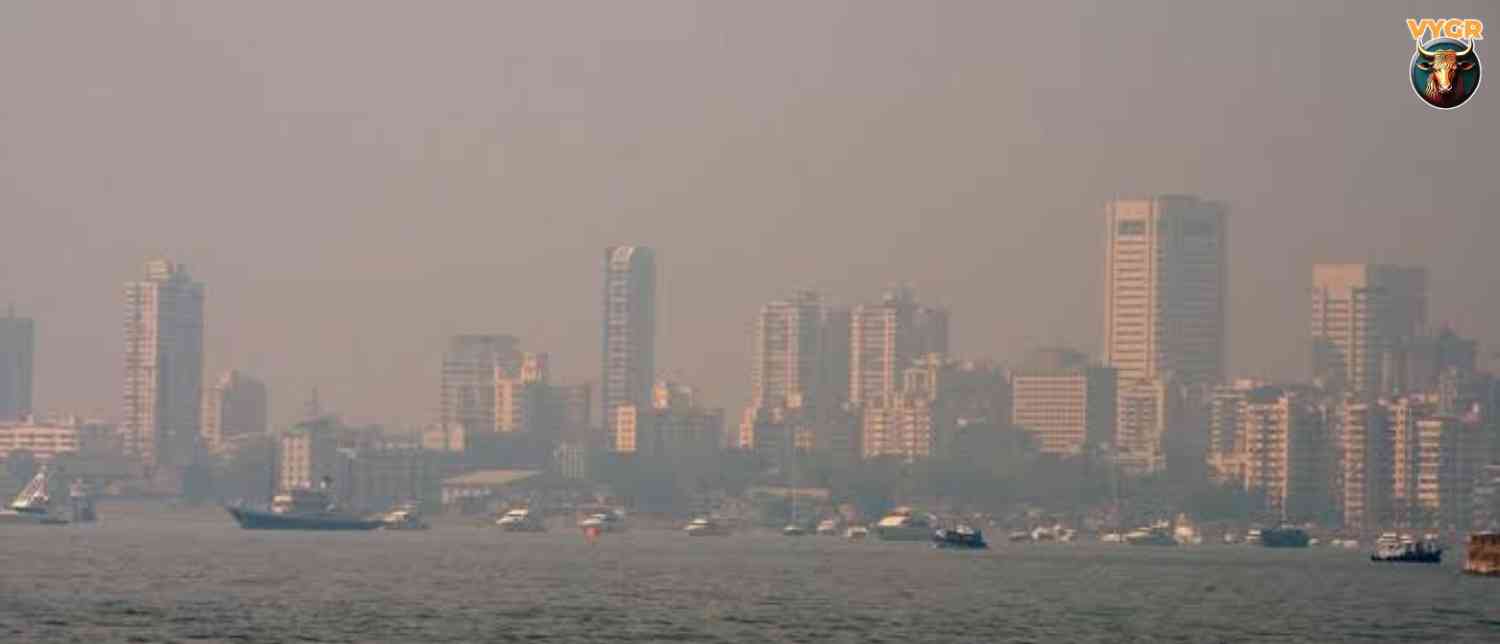
On October 15, a phone app told residents that Mumbai had the worst air in India. The government’s own dashboard, checked the same day, called it “satisfactory”. Both were, in their way, right. And that is the problem.
IQAir, the Swiss air-quality technology company, ranked Mumbai as India’s most polluted city that day, while the Central Pollution Control Board (CPCB) rated the city’s air “satisfactory”. For a city that is used to thinking of its sea breeze as a built-in air purifier, the gap raised an obvious question: which number should people believe?
The gap has not closed
The mismatch has persisted. On October 21, IQAir put Mumbai’s AQI at 165, a level in its “unhealthy” band, and ranked it above Delhi at 164. A later reading touched 167. The CPCB recorded 113 for the city that afternoon, a “moderate” rating on the Indian scale, after a city average of 102 until the day before.
The Bombay High Court has weighed in. Reports say it called the situation an “emergency” and asked how a coastal city could record such pollution despite its sea breeze. It also criticised civic authorities, the police and pollution-control officials for failing to enforce measures against air and noise pollution.
What the scientist says
Professor Sachchida Nand Tripathi of IIT Kanpur, an atmospheric scientist, a member of the steering committee of the National Clean Air Programme (NCAP) and dean of the Kotak School of Sustainability, urges caution before taking sides.
Asked why private and government readings differ so sharply, he says several factors could contribute, and it would be premature to conclude that either network is systematically overestimating or underestimating pollution. Private monitors, he explains, may capture localised hotspots near construction sites and traffic corridors, while government stations may represent different microenvironments. Technology, calibration, maintenance and humidity can also influence readings.
His point is a measured one. Differences between networks do not automatically mean that one is wrong. They may mean each is measuring something slightly different.
Why he is well placed to say it
Tripathi has worked on this exact question in Mumbai. Under a Sensor Technology Assessment Project with the Maharashtra Pollution Control Board, four start-ups installed low-cost air-quality sensors alongside reference-grade monitors across the Mumbai Metropolitan Region, and his team proposed a calibration method to cut the time sensors need to be co-located with reference instruments. The project was meant to test how far cheaper sensors can be trusted.
Why the same air gets two scores
Part of the difference is arithmetic. India and the United States use different scales, and India's is more lenient at the same pollution level.
As an illustration, take a 24-hour PM2.5 concentration of about 65 micrograms per cubic metre, a level near what some monitors in Mumbai showed in mid-October. On the Indian scale, that falls in the “moderate” band and works out to an AQI of roughly 115. On the US scale used by IQAir, it falls in the “unhealthy” band and works out to roughly 157. These figures are approximate calculations based on published breakpoints, not readings from any station.
Other differences add to the gap:
- Averaging period. The CPCB’s headline AQI uses 24-hour averages for particulate matter, which smooth out spikes. IQAir shows hourly values that capture sudden rises, particularly when a monitor sits close to a source.
- Type of instrument. The CPCB relies on reference-grade stations at fixed sites. Global trackers often combine government data with low-cost sensors, which are cheaper and more numerous but can be affected by humidity, which makes particles swell and read higher, and by calibration drift.
- Location. A station in a quiet residential area and a sensor beside a construction site can sit a few kilometres apart and tell two different stories.
- Which pollutant is used. Both systems report the worst pollutant, but if the main culprit differs, for example ozone on a hot afternoon rather than fine particles, the headline number changes.
What to check before trusting a number
Taking Tripathi’s caution together with these differences, a few questions help:
- Which scale is being used, Indian or US?
- Is it an hourly reading or a 24-hour average?
- Which pollutant is driving the number, PM2.5, PM10 or ozone?
- Where is the monitor, and is it a reference-grade station or a low-cost sensor?
- Do several nearby monitors agree?
If several sources point the same way, the picture is more reliable. If they split, the honest conclusion is that the air near some places is likely worse than the city average suggests.
What the city is doing
The Brihanmumbai Municipal Corporation announced an Air Pollution Control and Enforcement Action Plan-2026 on October 2, with hotspots identified in each ward, tighter checks on construction dust and waste burning, and resumed road washing. The court’s criticism suggests that enforcement is the weak point, and the difference in data is also a reminder that the city needs enough high-quality monitors to see where the pollution actually is.
What Mumbai should fix first
The extract of the interview I have seen covers only the question on private and government readings. Professor Tripathi’s views on priorities for the city are in the full interview, and I have not seen them, so this draft does not attribute any to him.
What to watch
Whether the High Court’s remarks lead to concrete enforcement, whether more reference-grade monitors are added, and whether the gap between the two networks narrows as sensors are calibrated.
© Copyright 2026. All Rights Reserved. Powered by Vygr Media.