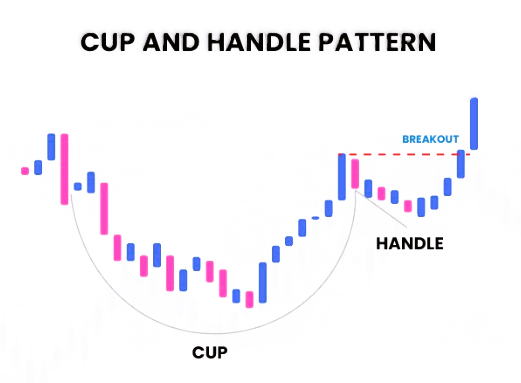
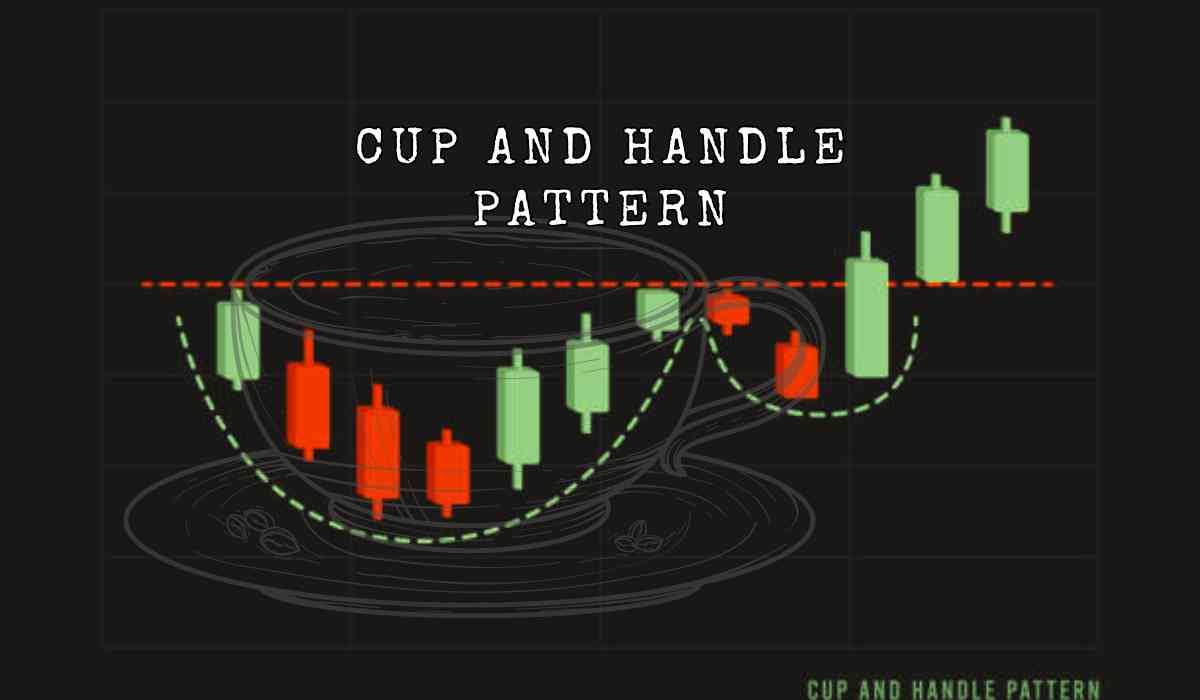
Every Indian household ever has a set of mis-matched cups in their homes, or we have different cup options for different occasions, but these usually ceramic cutlery has no actual meaning behind their shape and structures, but this Cup and Handle pattern that we are learning about today is a technical analysis tool used by traders to predict potential upward price movements. This pattern forms on a price chart when an asset's price trajectory resembles a "U" shape, followed by a slight downward drift, resembling a teacup with a handle. This pattern is considered a bullish continuation pattern, meaning that once the pattern is complete, the price is expected to rise.

How the Cup and Handle Pattern Works
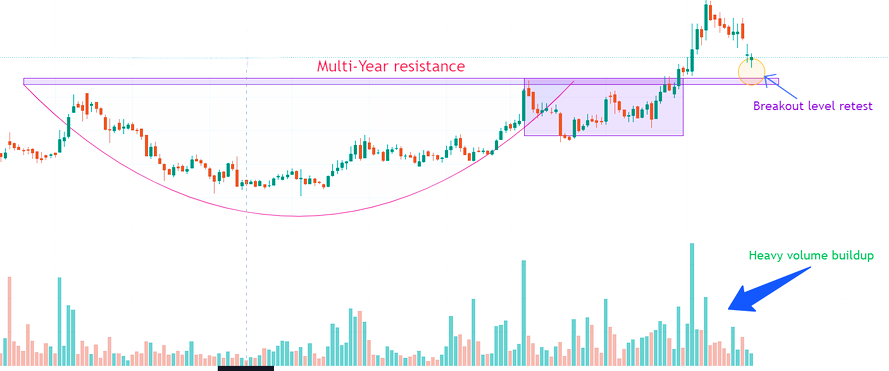
The cup part of the pattern represents a period of consolidation, where the price dips and then recovers, forming a rounded bottom. This is followed by the handle, which indicates a brief downward drift before a breakout occurs, leading to a price surge.
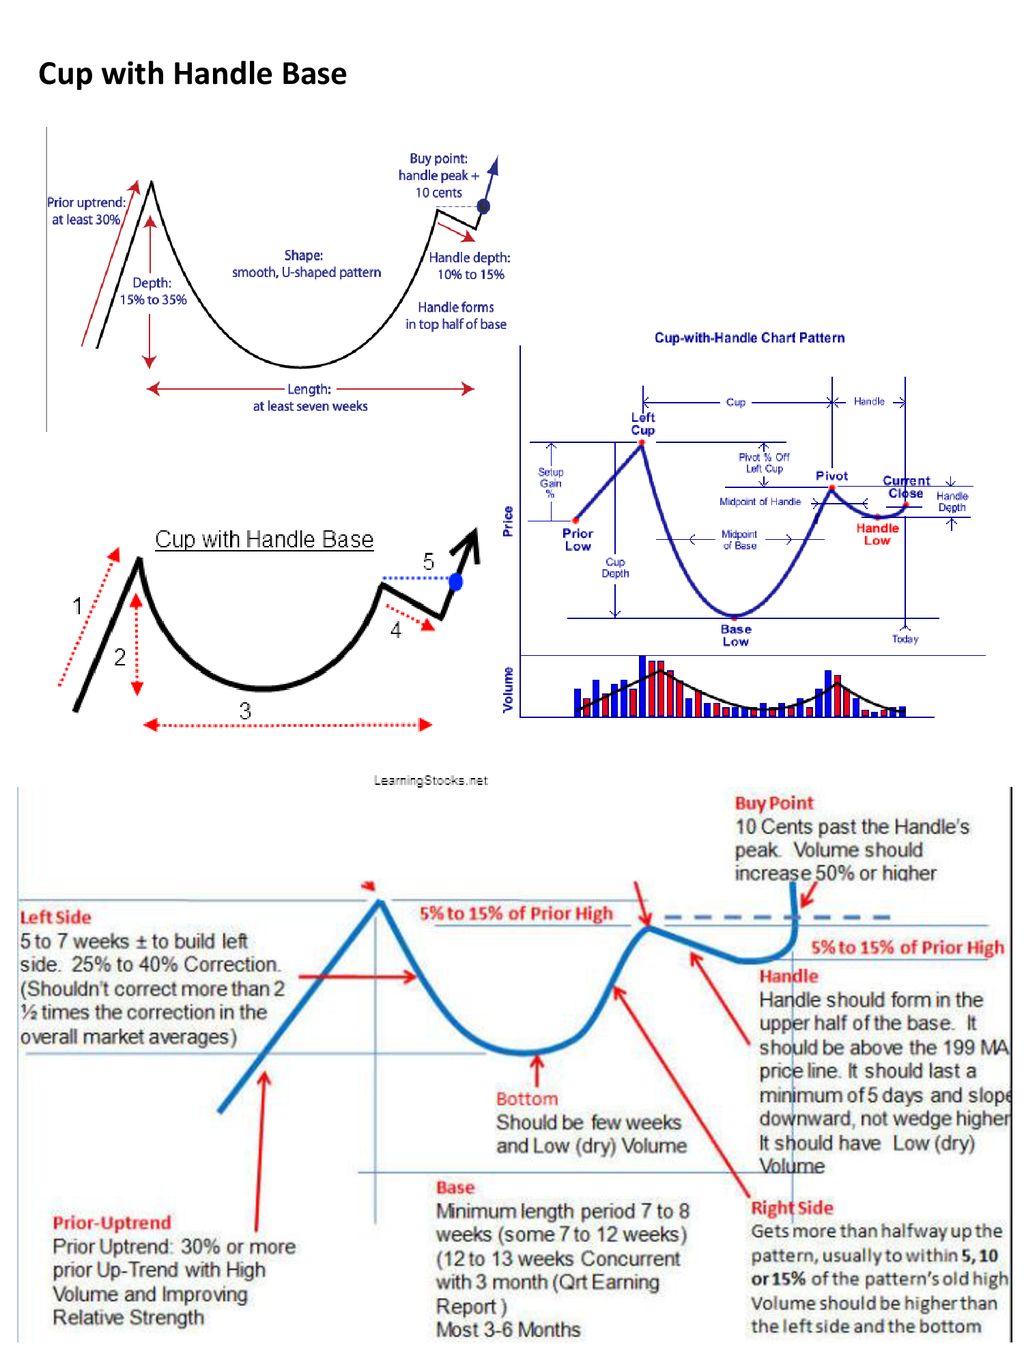
The pattern typically develops over several weeks to months, with the cup forming over one to six months, and the handle taking one to two weeks to shape. For traders, identifying the cup and handle pattern at the right time is crucial. The best entry point is often just above the handle's upper trendline, as this is where the breakout usually happens.

Historical Context and Significance
The cup and handle pattern was popularised by American technical analyst William J. O'Neil in his 1988 book, How to Make Money in Stocks. O'Neil detailed the characteristics of this pattern, explaining that it can last anywhere from seven weeks to 65 weeks. The pattern is most effective when it forms after a prolonged upward trend, signalling a continuation of that trend.
Trading with the Cup and Handle Pattern
When trading based on this pattern, several key factors must be considered:
- Shape of the Cup: The cup should have a rounded "U" shape, not a sharp "V." A gradual curve indicates a stronger potential for upward movement.
- Handle Formation: The handle should form below the cup's resistance level and should not be too deep. The breakout from the handle typically signals a strong buying opportunity.
- Volume: Volume plays a critical role. During the cup formation, trading volume should decrease, then increase as the price begins to rise again.
- Past Trend: The pattern is more reliable when it follows a consistent upward trend, rather than appearing suddenly after erratic movements.
Variations and Potential Pitfalls
♦ Inverse Cup and Handle: This is the bearish version of the pattern, where the cup is inverted, and the handle slopes upward. This variation signals a potential downtrend and is used to identify selling opportunities.
♦ Pattern Limitations: Despite its popularity, the Cup and Handle pattern has some limitations. For example, the formation can take a long time to complete, leading to delayed trading decisions. Also, the depth of the cup and handle can vary, sometimes producing false signals, especially in illiquid stocks.
♦ Pattern Failures: A pattern failure, or "failed Cup and Handle," occurs when the price briefly breaks out above the resistance but fails to sustain the upward momentum and reverses. In such cases, a properly set stop-loss can help minimise losses.
_1724842630.png)
Additional Tips for Success
-
Shorter Handles Perform Better: Patterns with shorter handles tend to have higher success rates compared to those with longer handles.
-
Confirm with Larger Time Frames: It’s beneficial to check the pattern against longer time frames. For example, a pattern that looks bullish on a 15-minute chart but is in a downtrend on a daily chart might not be a strong buy signal.
-
Use in Combination with Other Indicators: To improve accuracy, it's recommended to use the Cup and Handle pattern alongside other technical indicators and signals. This approach helps confirm the pattern's reliability and reduces the risk of false signals.
Conclusion
The cup and handle pattern is a valuable indicator for spotting potential bullish continuations in an asset's price. By understanding its formation and carefully analysing the chart, traders can identify profitable entry points. However, like all technical analysis tools, it should be used with caution and in conjunction with other indicators to ensure a comprehensive trading strategy.
Inputs by Agencies
Image Source: Multiple Agencies
Ⓒ Copyright 2024. All Rights Reserved Powered by Vygr Media.


